

|
|
Emergence of Chaos
(There is order in chaos)An iterative process with a simple quadratic equation
A study of iterations with another quadratic equation
In the real domain, iterative processes admit quite a transparent graphical representation. Start with x0. Draw a vertical line until it intersects the graph of
On the diagram, subsequent iterates become closer and closer and each closer to the point of intersection of the graph and the diagonal. The point of intersection is a solution of the equation
Below, the applet's panel is split into two parts - left and right. The horizontal
axis on the right corresponds to a parameter a changing from .7 through 1. When you
select a parameter by clicking on the right graph, on the left, the function
Now let's experiment with the iterations as a changes. For a while the equation
After a = 0.86237... the two curves split further into four whereas the iteration oscillate between four different points. Next four points are replaced by 8 and 8 by 16 and so on. Note too that the horizontal distance between the split points (points of bifurcation) grows shorter and shorter. Until the bifurcation becomes so fast at the point a=.892 that iterates race all over a segment instead of alternating between a few fixed points. The behavior is chaotic in the sense that it's absolutely impossible to predict where the next iterate will appear. Ian Stewart (p. 58) gives the following definition: Chaos is apparently random behavior with purely deterministic causes.
Interestingly, for some values of a even after the point 0.86237... there appears some regularity. You can easily find a window where iterates oscillate between three different points forming a 3-cycle. If you are patient you'll be able to detect a 6-cycle as well. Of course there are 12- and 24-cycles and others. The program is just not accurate enough to support deeper investigation.
The reason for the bifurcation may be surmised from the graph of the second iterate function
As of 2018, Java plugins are not supported by any browsers (find out more). This Wolfram Demonstration, Cobweb Diagram for Generalized Logistic Maps with z-Unimodality, shows an item of the same or similar topic, but is different from the original Java applet, named 'chaos'. The originally given instructions may no longer correspond precisely.
(image below from deprecated 'chaos' applet)
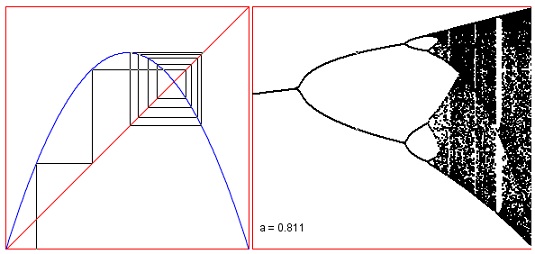
(To start iterations, click above in the right portion of the applet. Wait, then click at a different point... or in the left part.)
Instead of the applet you can download and run locally an application that is performing exactly the same job.
The terminology is as follows.
- The point x is stationary (or fixed) for y=f(x) iff x=f(x).
- A stationary point x is attractive iff for x0 sufficiently close to x the iteration {xn} converge to x.
- A stationary point x is repelling iff no iterations {xn} with x0≠x ever converge to x.
- A finite sequence of points {xn, xn+1, ..., xn+p-1} with
p > 1, is a p-cycle iffxn = f(xn+p-1) andxn ≠ f(xn+q-1) for2 ≤ q < p. Cycles may be both attractive and repelling.
You can observe from the graphs that their slopes behave differently at the attractive and repelling points. A point x is attractive if |slope(f(x))|<1. A point x is repelling if |slope(f(x))|>1.
Another thing is worth noting. With the parameter a near but less than 0.75, the slope of the graph at the stationary point is less than 1 in absolute value. As a approaches 0.75 the absolute value of the slop grows and, at 0.75, becomes 1. This makes the point unstable and eventually causes the iterations split into a 2-cycle. First the 2-cycle is attractive. Then, as a grows, it loses its stability and, eventually, splits into a 4-cycle.
References
- J. Gleick, Chaos, Viking, 1987
- D. R. Hofstadter, Metamagical Themas, Basic Books, Inc., 1985, Chapter 16.
- B. Mandelbrot, The Fractal Geometry of Nature, W.H.Freeman and Co., NY, 1977.
- Chaos and Fractals, R. L. Devaney and Linda Keen, eds., AMS, 1989.
- Heinz-Otto Peitgen et al, Chaos and Fractals: New Frontiers of Science , Springer, 2nd edition, 2004
- G. Strang, Introduction to Applied Mathematics, Wellesley-Cambridge Press, MA, 1986.
- I. Stewart, Nature's Numbers, Basic Books, 1997.
74277067 |
Copyright © 1996-2018 Alexander Bogomolny |